

Audit entries are kept for 90 days by default, so the page shows at most that far back. The on-prem administrator can change this in Log retention.
Layout overview
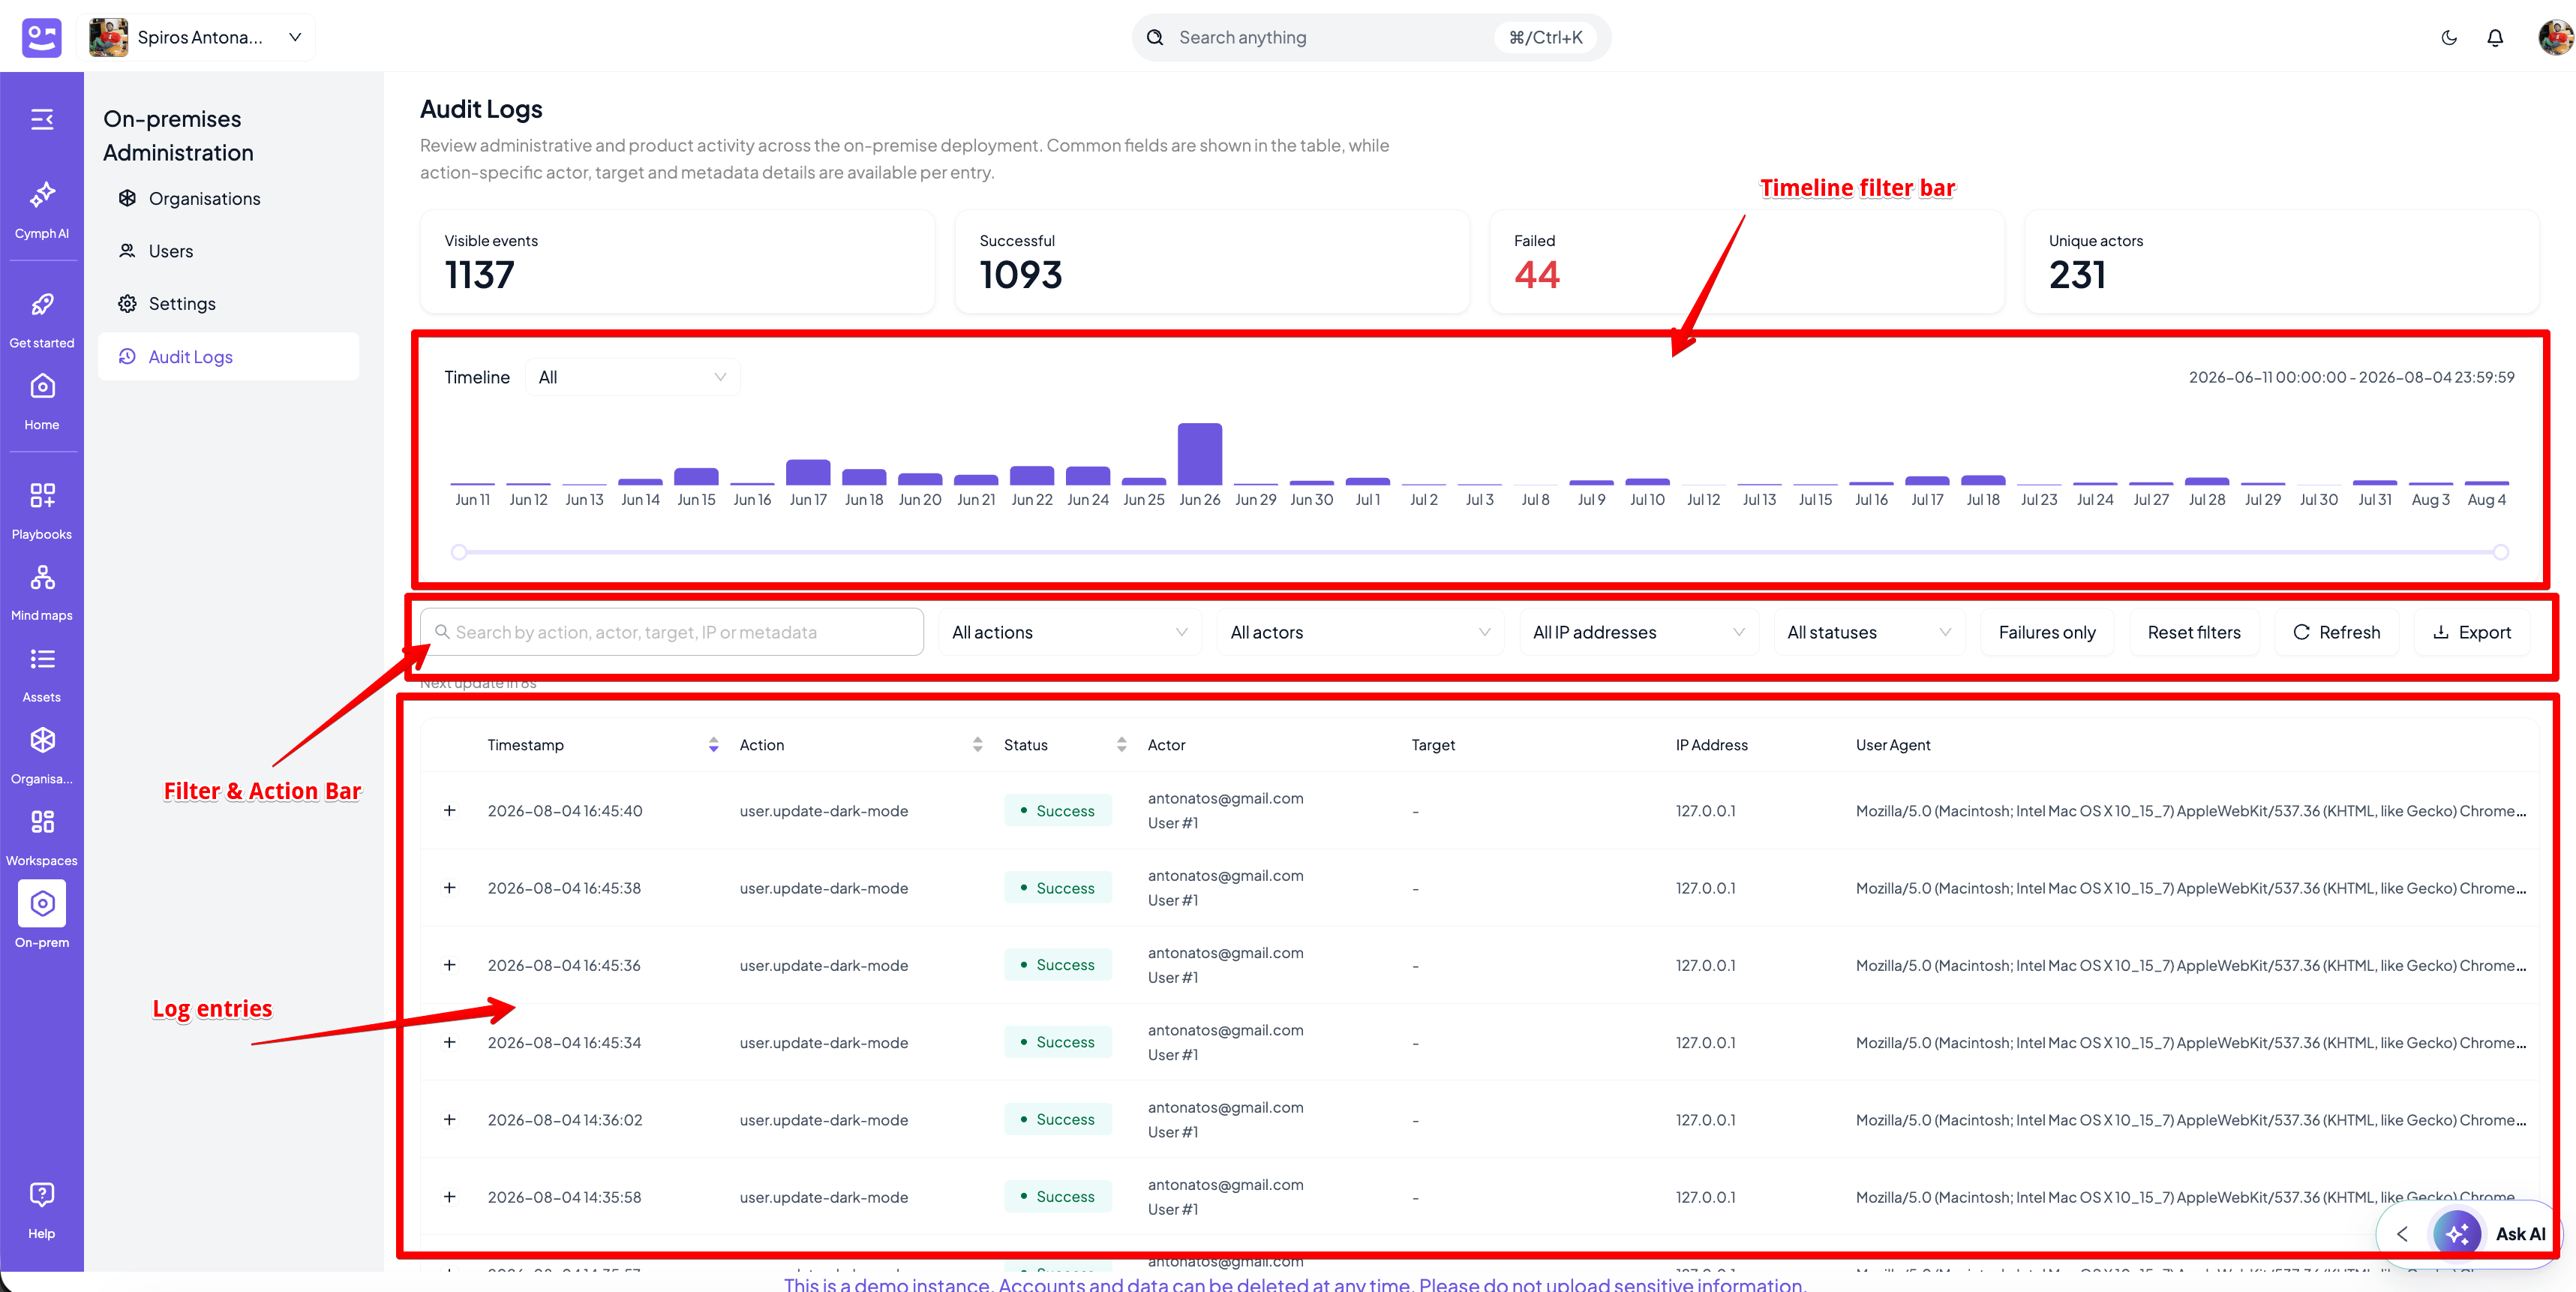
The page is organised, top to bottom, into four regions:- Summary cards — headline counts for the currently visible entries.
- Timeline filter bar — a histogram of activity over time with a range selector.
- Filter & Action bar — search, dropdown filters, and actions (refresh, reset, export).
- Log entries — the paginated, sortable, expandable table of events.
1. Summary cards
Four cards summarise the currently filtered set of entries (not the full dataset):
Because these are computed from the filtered result, narrowing the timeline or applying a filter updates the counts immediately.
2. Timeline filter bar
A daily activity histogram that doubles as a time-range control.- Bars — one bar per day that has activity; bar height is the event count for that day. Hovering a bar shows a tooltip with the date and count. Bars inside the selected window are highlighted (purple); bars outside are muted (grey).
- Timeline preset dropdown — quick presets: All, Today, Last month, Last 3 months, Last 6 months, Last year, and Custom. Selecting a preset snaps the range slider to the matching window.
- Range slider — the dual-handle slider below the histogram lets you drag either end to set a custom start/end day. Dragging it automatically switches the preset to Custom.
- Range label — the timestamp on the right (e.g.
2026-06-11 00:00:00 - 2026-08-04 23:59:59) shows the exact start and end of the selected window.
3. Filter & Action bar
A row of controls that filter the table and drive page actions. Every filter is combined with AND logic and layered on top of the timeline window.Auto-refresh
The page automatically re-fetches every 30 seconds. TheNext update in Ns label next to the actions counts down to the next refresh; clicking Refresh resets the countdown.
4. Log entries
The main table lists individual events. Rows with afail status are tinted with the danger background so failures stand out.
Columns
Row expansion
Every row is expandable (the+ control on the left). Expanding a row reveals the complete entry as pretty-printed JSON — including the full actor, target, and any action-specific metadata that isn’t shown in the columns.
Pagination
The table paginates at 10 rows per page.Export format
Exports contain the same filtered rows as the table:- CSV — columns: Timestamp, Action, Status, Actor Email, Actor User ID, Target, IP Address, User Agent, Metadata (metadata serialised as JSON). Filename:
audit-logs-<YYYYMMDD-HHmmss>.csv. - JSON — the raw entries (minus the internal row key). Filename:
audit-logs-<YYYYMMDD-HHmmss>.json.