> ## Documentation Index
> Fetch the complete documentation index at: https://docs.cymph.io/llms.txt
> Use this file to discover all available pages before exploring further.
# Playbook Insights
The **Playbook Insights** view is a dedicated analytics dashboard within **My Playbooks** that gives you a bird's-eye view of your playbook portfolio. It surfaces risk signals, coverage gaps, distribution metrics, and engagement stats so you can quickly understand the health and maturity of your playbooks at a glance.
To access Playbook Insights, navigate to **My Playbooks** and select the **Playbook Insights** tab.
## Filters
At the top of the page you will find a **Saved Filters** selector and a **Filters** button. These work the same way as in other playbook views — they let you scope all the data on the page down to a specific subset of playbooks (e.g. by label, stage, source, or incident type). Any filter you apply affects all widgets on the page simultaneously.
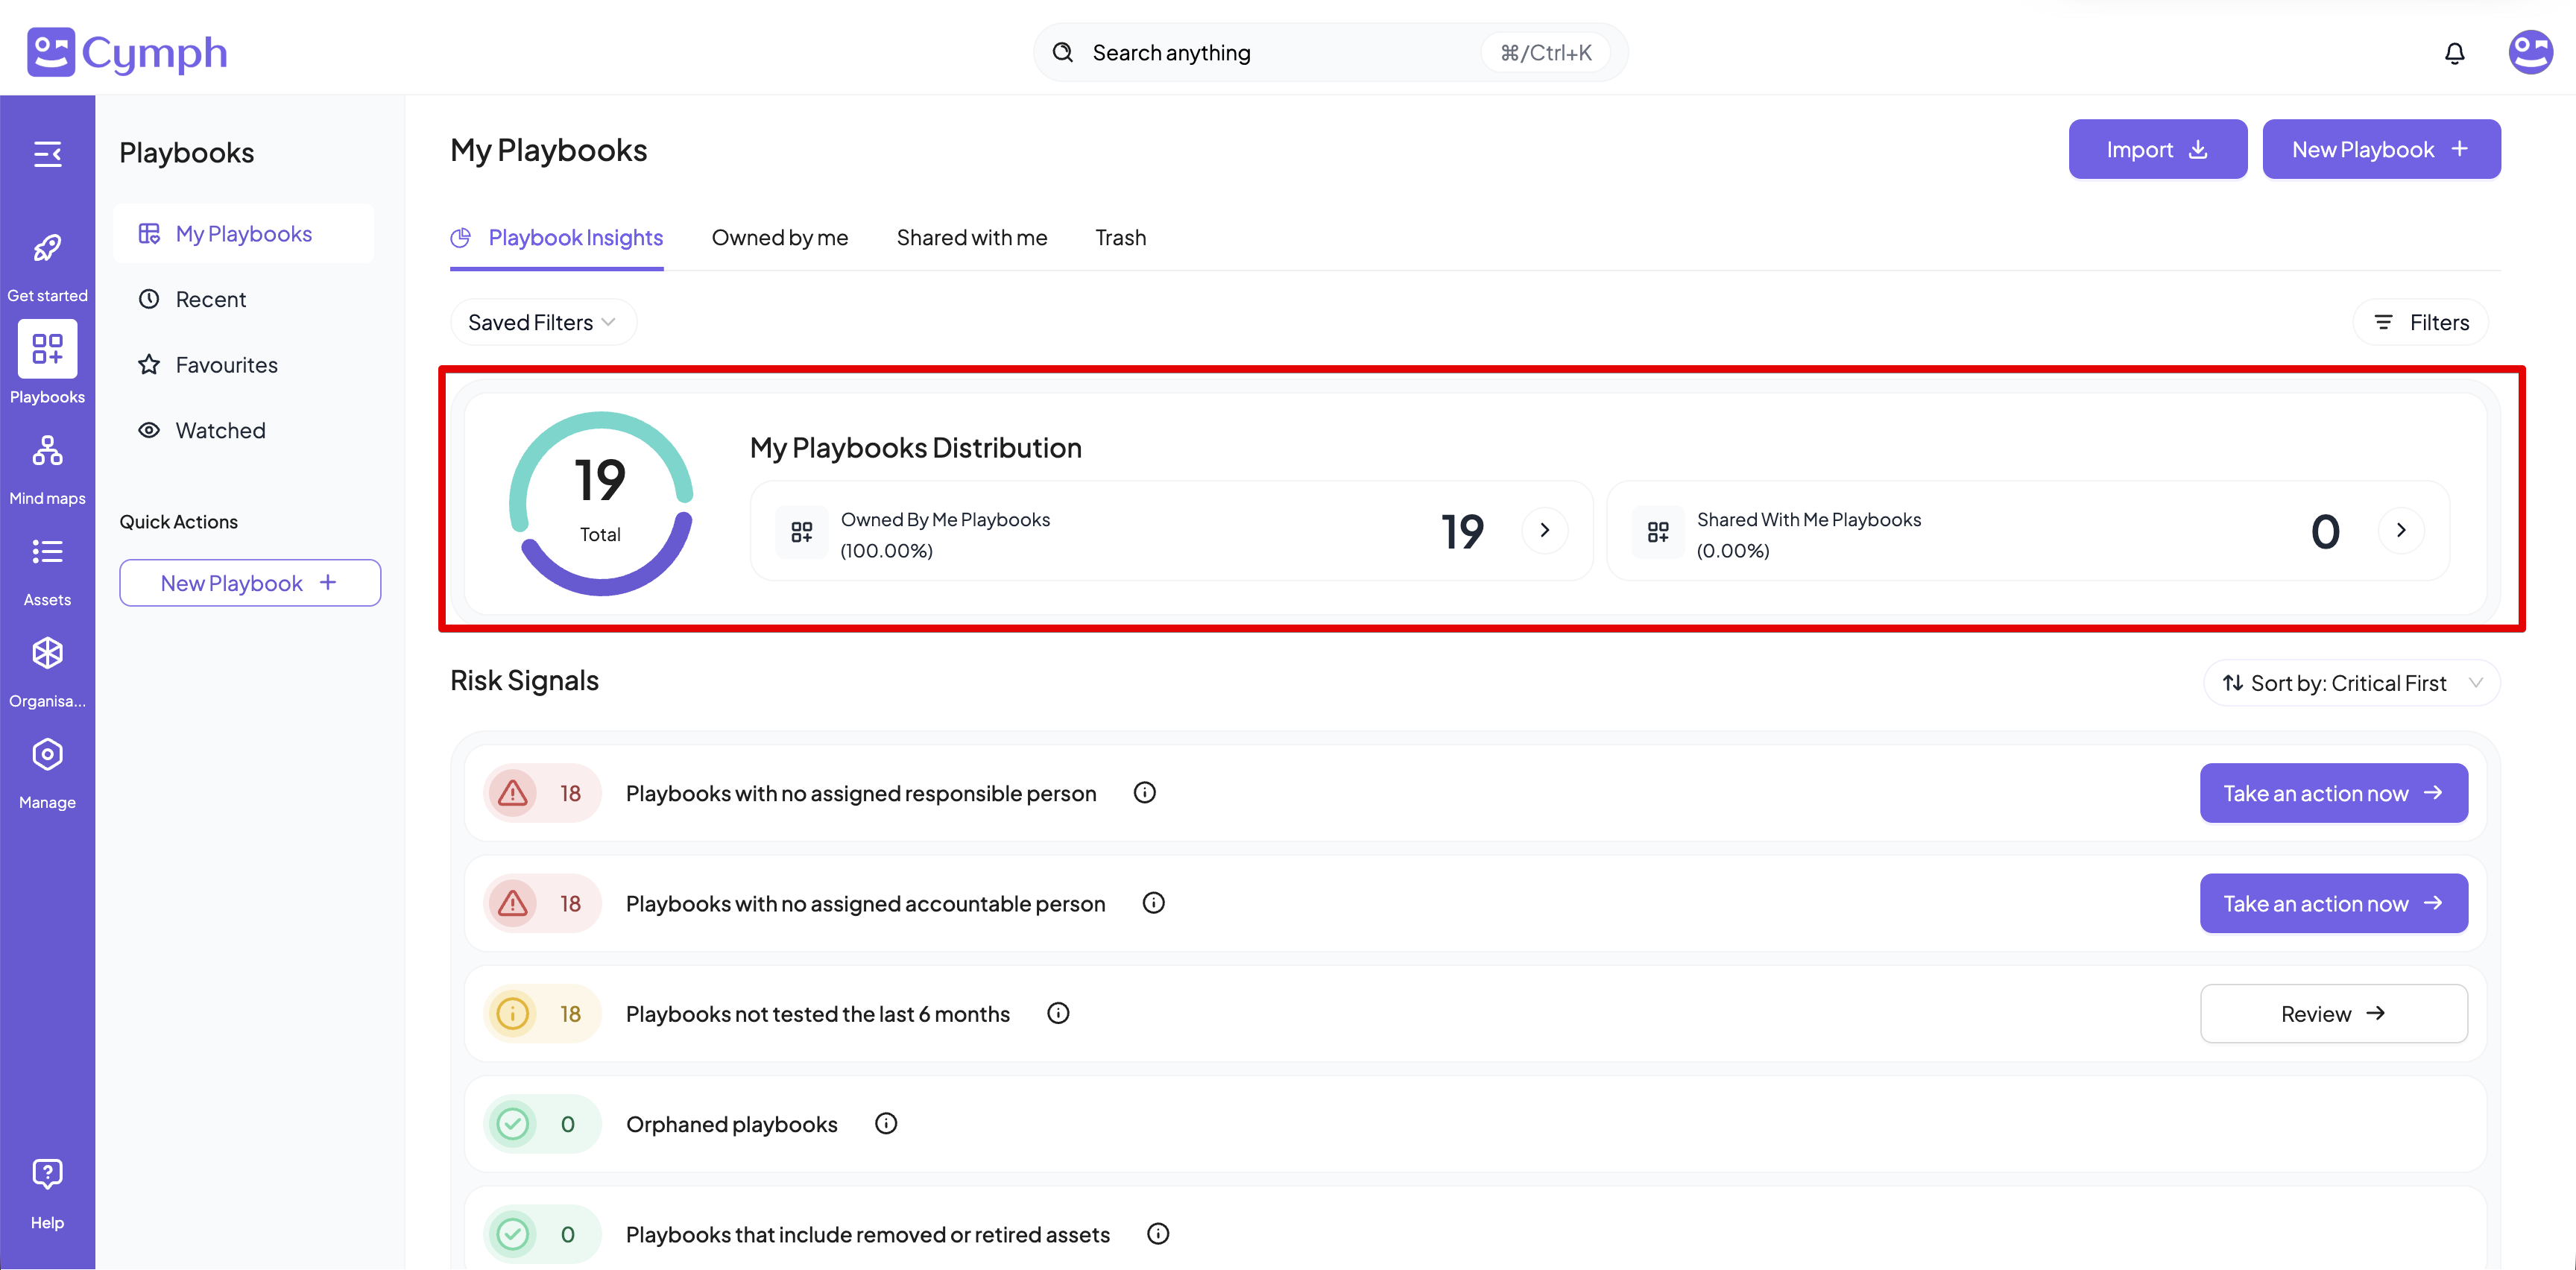
## My Playbooks Distribution
This summary widget shows the total number of playbooks in scope and breaks them down into two categories:
* **Owned By Me Playbooks**: The count and percentage of playbooks you own.
* **Shared With Me Playbooks**: The count and percentage of playbooks others have shared with you.
Each category is clickable and takes you directly to the corresponding filtered view (**Owned by me** or **Shared with me**).
 ## Risk Signals
The **Risk Signals** section highlights operational gaps and governance issues across your playbooks. Each signal shows a count of affected playbooks and an action button so you can address it immediately.
You can sort the signals using the **Sort by** dropdown (default: **Critical First**).
The available signals are:
* **Playbooks with no assigned responsible person**: Playbooks that are missing a RACI-assigned responsible owner. Click **Take an action now** to bulk-assign one.
* **Playbooks with no assigned accountable person**: Playbooks without an accountable stakeholder. Click **Take an action now** to address this.
* **Playbooks not tested the last 6 months**: Playbooks that have not been exercised or validated recently. Click **Review** to go through them.
* **Playbooks not reviewed.** Playbooks that are due for review.
* **Playbooks without review settings**. Playbook that have no assigned reviewer and review frequency.
* **Orphaned playbooks**: The responsible or accountable person no longer has access to this playbook, for example the account is deleted, the user has been removed from the workspace or the playbook is unshared. Revise the RACI matrix to maintain accountability and governance of workflows.
* **Playbooks with stale consulted, informed, or reviewer assignees**: A consulted, informed, or the reviewer no longer has access to this playbook. Update the RACI matrix and reviewer settings to keep stakeholders aligned
* **Playbooks that include removed or retired assets**: Playbooks still referencing assets that have been deleted or retired from the platform.
* **Playbooks without mappings**: Playbooks that have no framework or incident type mappings.
* **Playbooks not updated the last 6 months**: Playbooks that may be stale and need a review.
* **Overly complex playbooks (30+ steps)**: Playbooks that exceed 30 steps and may benefit from being split into smaller, more focused procedures.
Use the **Show Less / Show More** toggle to collapse or expand the full list of signals.
## Top Framework Tags
This panel lists the most-used framework technique tags across your playbooks. You can filter by framework using the dropdown (e.g. **MITRE ATT\&CK Matrix for Enterprise**) and sort the results with the **Sort by** dropdown (default: **Most Used**).
The table shows two columns:
* **Tag**: The technique identifier and name (e.g. *T1046 - Network Service Discovery*). Each tag is a clickable chip that filters the playbook list.
* **Linked Playbooks**: The number of playbooks associated with that tag.
You can page through the results using the pagination arrows at the bottom of the panel.
## Framework Mapping Overview
This panel sits alongside **Top Framework Tags** and gives a per-framework summary of your mapping coverage. It shows:
* **Framework**: The name of the framework (e.g. *MITRE ATT\&CK Matrix for Enterprise*).
* **Linked Playbooks**: How many playbooks are mapped to that framework.
Below the table, three counters show the breakdown:
* **Mapped Playbooks**: Playbooks that have at least one framework tag.
* **Unmapped Playbooks**: Playbooks with no framework mapping at all.
* **Multimapped Playbooks**: Playbooks mapped to more than one framework.
Use the pagination arrows to move between frameworks.
## Incident Type Distribution
This bar chart shows how your playbooks are distributed across incident types (e.g. *Phishing*, *Data exfiltration*, *Social engineering*, *Spoofing*). Use the **Sort by** dropdown to change the ordering of the bars. Hovering over each bar reveals the exact playbook count for that incident type.
Pagination arrows allow you to browse incident types if there are more than can fit on one page.
## Insights (Quick Stats)
Below the distribution charts, four highlight cards surface the most important single-value metrics from your current playbook set:
* **Top Incident Type**: The incident type with the most linked playbooks, along with the count of linked playbooks.
* **Main Source**: The source (e.g. *Cymph*) that contributes the largest number of playbooks to your library.
* **Most Targeted Asset**: The asset referenced most frequently across your playbooks, along with the number of playbooks that reference it.
* **Most Viewed Playbook**: The individual playbook that has been opened the most times, along with the total open count.
## Labels
The **Labels** widget renders a word cloud of all labels assigned to playbooks in the current view. Labels that appear more frequently are displayed in a larger font. This gives you a quick visual summary of the most common themes, tactics, and categories across your playbook library.
## Playbook Source Origin
This donut chart shows the percentage breakdown of your playbooks by source origin (e.g. *Cymph*, imported from a SOAR, etc.). Hovering over each segment reveals the source name and its percentage.
## Automation Degree
This bar chart shows how many playbooks fall into each automation bracket:
* **0%**: No automation
* **1–25%**: Low automation
* **26–50%**: Moderate automation
* **51–75%**: High automation
* **76–100%**: Fully or near-fully automated
This helps you understand how much of your playbook portfolio can run without manual intervention and where investment in automation could be most impactful.
## Stage Distribution
This horizontal stacked bar chart shows the proportion of playbooks in each lifecycle stage:
* **Live** (green): The playbook is active and usable.
* **Draft** (purple): The playbook is a work in progress.
* **Revoked** (red): The playbook has been retired and is no longer in use.
The percentage for each stage is displayed directly on the bar.
## Impact and Severity Distribution
Two horizontal bar charts show the distribution of your playbooks by their assigned **Impact** and **Severity** values. The scale for both ranges across: **Not Specified**, **Low**, **Medium**, **High**, and **Critical**. These fields are set on each individual playbook and help you understand the overall risk posture of your library.
## Incident Response Stage Distribution
This bar chart shows how your playbooks are distributed across incident response stages (e.g. *Containment*, *Recovery*, *Preparation*, *etc.*). Use the **Sort by** dropdown to change the ordering of the bars. Hovering over each bar reveals the exact playbook count for that incident type.
Pagination arrows allow you to browse incident types if there are more than can fit on one page.
## Last Test Distribution
This bar chart shows the period where your playbooks were last tested / exercised. Ranges are split into the following periods:
* Never tested
* Last month
* 1–6 months ago
* 6–12 months ago
* Over a year ago
## Linked With Assets Breakdown
This pie chart shows how many playbooks are linked with assets, either directly or via asset types.
## Risk Signals
The **Risk Signals** section highlights operational gaps and governance issues across your playbooks. Each signal shows a count of affected playbooks and an action button so you can address it immediately.
You can sort the signals using the **Sort by** dropdown (default: **Critical First**).
The available signals are:
* **Playbooks with no assigned responsible person**: Playbooks that are missing a RACI-assigned responsible owner. Click **Take an action now** to bulk-assign one.
* **Playbooks with no assigned accountable person**: Playbooks without an accountable stakeholder. Click **Take an action now** to address this.
* **Playbooks not tested the last 6 months**: Playbooks that have not been exercised or validated recently. Click **Review** to go through them.
* **Playbooks not reviewed.** Playbooks that are due for review.
* **Playbooks without review settings**. Playbook that have no assigned reviewer and review frequency.
* **Orphaned playbooks**: The responsible or accountable person no longer has access to this playbook, for example the account is deleted, the user has been removed from the workspace or the playbook is unshared. Revise the RACI matrix to maintain accountability and governance of workflows.
* **Playbooks with stale consulted, informed, or reviewer assignees**: A consulted, informed, or the reviewer no longer has access to this playbook. Update the RACI matrix and reviewer settings to keep stakeholders aligned
* **Playbooks that include removed or retired assets**: Playbooks still referencing assets that have been deleted or retired from the platform.
* **Playbooks without mappings**: Playbooks that have no framework or incident type mappings.
* **Playbooks not updated the last 6 months**: Playbooks that may be stale and need a review.
* **Overly complex playbooks (30+ steps)**: Playbooks that exceed 30 steps and may benefit from being split into smaller, more focused procedures.
Use the **Show Less / Show More** toggle to collapse or expand the full list of signals.
## Top Framework Tags
This panel lists the most-used framework technique tags across your playbooks. You can filter by framework using the dropdown (e.g. **MITRE ATT\&CK Matrix for Enterprise**) and sort the results with the **Sort by** dropdown (default: **Most Used**).
The table shows two columns:
* **Tag**: The technique identifier and name (e.g. *T1046 - Network Service Discovery*). Each tag is a clickable chip that filters the playbook list.
* **Linked Playbooks**: The number of playbooks associated with that tag.
You can page through the results using the pagination arrows at the bottom of the panel.
## Framework Mapping Overview
This panel sits alongside **Top Framework Tags** and gives a per-framework summary of your mapping coverage. It shows:
* **Framework**: The name of the framework (e.g. *MITRE ATT\&CK Matrix for Enterprise*).
* **Linked Playbooks**: How many playbooks are mapped to that framework.
Below the table, three counters show the breakdown:
* **Mapped Playbooks**: Playbooks that have at least one framework tag.
* **Unmapped Playbooks**: Playbooks with no framework mapping at all.
* **Multimapped Playbooks**: Playbooks mapped to more than one framework.
Use the pagination arrows to move between frameworks.
## Incident Type Distribution
This bar chart shows how your playbooks are distributed across incident types (e.g. *Phishing*, *Data exfiltration*, *Social engineering*, *Spoofing*). Use the **Sort by** dropdown to change the ordering of the bars. Hovering over each bar reveals the exact playbook count for that incident type.
Pagination arrows allow you to browse incident types if there are more than can fit on one page.
## Insights (Quick Stats)
Below the distribution charts, four highlight cards surface the most important single-value metrics from your current playbook set:
* **Top Incident Type**: The incident type with the most linked playbooks, along with the count of linked playbooks.
* **Main Source**: The source (e.g. *Cymph*) that contributes the largest number of playbooks to your library.
* **Most Targeted Asset**: The asset referenced most frequently across your playbooks, along with the number of playbooks that reference it.
* **Most Viewed Playbook**: The individual playbook that has been opened the most times, along with the total open count.
## Labels
The **Labels** widget renders a word cloud of all labels assigned to playbooks in the current view. Labels that appear more frequently are displayed in a larger font. This gives you a quick visual summary of the most common themes, tactics, and categories across your playbook library.
## Playbook Source Origin
This donut chart shows the percentage breakdown of your playbooks by source origin (e.g. *Cymph*, imported from a SOAR, etc.). Hovering over each segment reveals the source name and its percentage.
## Automation Degree
This bar chart shows how many playbooks fall into each automation bracket:
* **0%**: No automation
* **1–25%**: Low automation
* **26–50%**: Moderate automation
* **51–75%**: High automation
* **76–100%**: Fully or near-fully automated
This helps you understand how much of your playbook portfolio can run without manual intervention and where investment in automation could be most impactful.
## Stage Distribution
This horizontal stacked bar chart shows the proportion of playbooks in each lifecycle stage:
* **Live** (green): The playbook is active and usable.
* **Draft** (purple): The playbook is a work in progress.
* **Revoked** (red): The playbook has been retired and is no longer in use.
The percentage for each stage is displayed directly on the bar.
## Impact and Severity Distribution
Two horizontal bar charts show the distribution of your playbooks by their assigned **Impact** and **Severity** values. The scale for both ranges across: **Not Specified**, **Low**, **Medium**, **High**, and **Critical**. These fields are set on each individual playbook and help you understand the overall risk posture of your library.
## Incident Response Stage Distribution
This bar chart shows how your playbooks are distributed across incident response stages (e.g. *Containment*, *Recovery*, *Preparation*, *etc.*). Use the **Sort by** dropdown to change the ordering of the bars. Hovering over each bar reveals the exact playbook count for that incident type.
Pagination arrows allow you to browse incident types if there are more than can fit on one page.
## Last Test Distribution
This bar chart shows the period where your playbooks were last tested / exercised. Ranges are split into the following periods:
* Never tested
* Last month
* 1–6 months ago
* 6–12 months ago
* Over a year ago
## Linked With Assets Breakdown
This pie chart shows how many playbooks are linked with assets, either directly or via asset types.